Monitoring and diagnosis of electrical equipment, in particular power transformers, considerable attention for many years. It is of great importance for the utilities to find the incipient faults in these transformers as early as possible.
Dissolved gas analysis (DGA) is one of the most useful techniques to detect incipient faults in oil-filled power.Various methods have been developed to interpret DGA results such as IEC ratio code, Rogers method and Duval triangle method.
What is DGA testing?
DGA testing is one of the diagnostic tests we can run on the dielectric fluid in a power transformer. Dielectric fluid inevitably contains a profile of trace gases, so every transformer with fluid has a fingerprint of these gases. Once you establish a baseline, you can watch for trends in how the concentration of those gases change over time. Significant changes are indicative of an incipient fault condition.
One of the most frequently used DGA methods is Duval triangular. It is a graphical method that allows one to follow the faults more easily and more precisely.
The Duval Triangle DGA Diagnostic Method:
The Duval Triangle diagnostic method for oil-insulated high-voltage equipment (mainly transformers), developed by Michel Duval in 1974 and described in Appendix B of IEC 60599:1999.
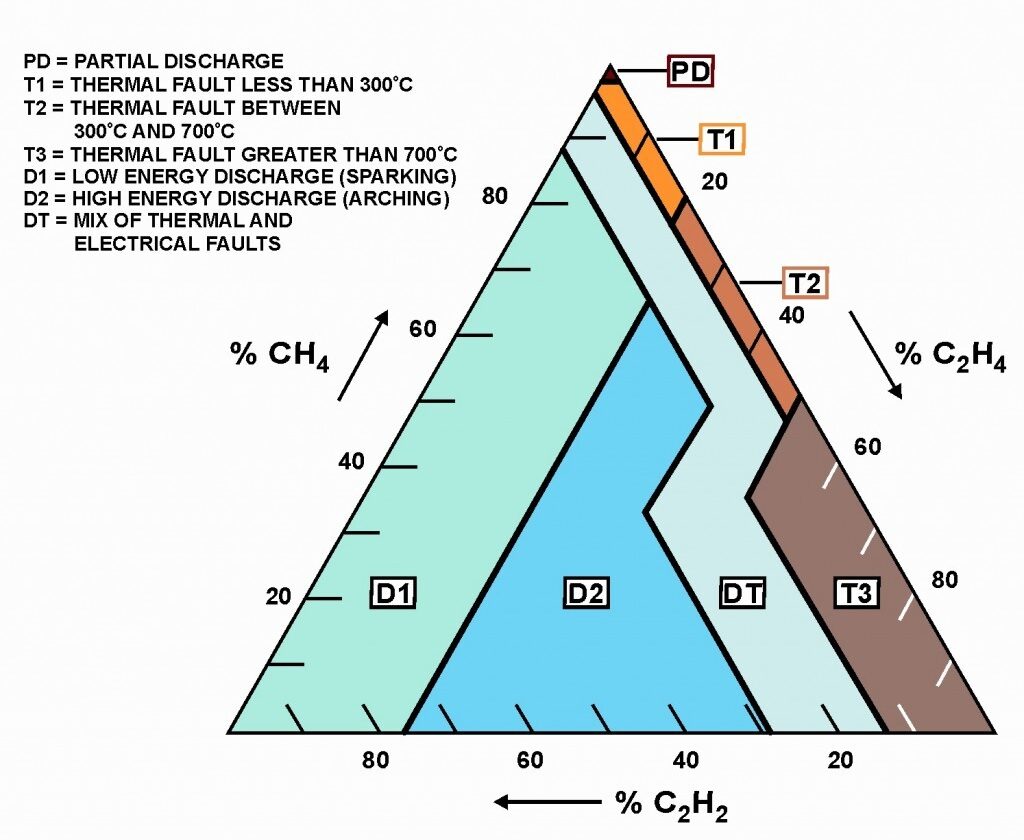
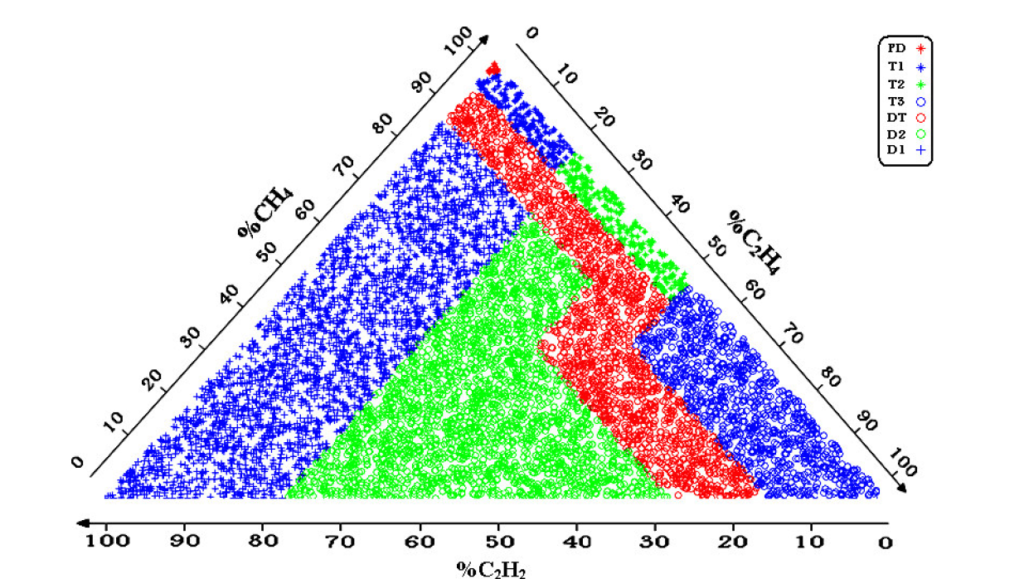
Concentrations (ppm) of methane (CH4), ethylene (C2H4), and acetylene (C2H2) are expressed as percentages of the total (CH4 + C2H4 + C2H2) and plotted as a point (%CH4, %C2H4, %C2H2) in a triangular coordinate system on a triangular chart which has been subdivided into fault zones. The fault zone in which the point is located designates the likely fault type which produced that combination of gas concentrations.
Applicability
Do not use the Duval triangle to determine if a transformer has a fault, the triangle will always indicate a fault because there is no area allocated to ‘No fault’. The triangle should only be used to diagnose what the fault is, not if the transformer has a fault or not.
Because of the relative inaccuracy of gas-in-oil concentration measurements at low concentrations, DGA diagnostic methods, including the Duval Triangle, should not be applied unless the gas concentrations are well above the detection limit.
If reasonably stable concentrations of the gases were present before the onset of the suspected fault, it is advisable to subtract out the background concentrations, provided that the differences are large enough for interpretation. The diagnosis should be based on recently-formed gas if possible, and including pre-fault gas in the diagnostic calculations can lead to misleading results.
Calculation Method
The three sides of the Triangle are expressed in triangular coordinates (P1, P2, P3) representing the relative proportions of CH4, C2H4 and C2H2, from 0 to 100 for each gas. These three gases in ppm, CH4 = g1, C2H4 = g2 and C2H2 = g3, must be transformed into triangular coordinates before being plotted onto the triangle. First the sum of these three values, g1+g2+g3, should be calculated and then the relative proportion of the three gases:
P1 = %CH4 = 100 × g1/(g1+g2+g3),
P2 = %C2H4 = 100 × g2/(g1+g2+g3),
P3 = %C2H2 = 100× g3/(g1+g2+g3).
Example:
Suppose that a transformer is found to have recent increases of 70 ppm of CH4, 110 ppm of C2H4, and 20 ppm of C2H2. Such a significant increase in C2H4 and C2H2 is sufficient justification to suspect a fault and to apply the Duval Triangle method.
Calculate Total T(g) = CH4 (g1) + C2H4 (g2)+ C2H2 (g3) = 70 + 110 + 20 =200.
Express the amount of each gas as a percentage of T(g).
P1 = %CH4 =100 × CH4 (g1) / T(g) = 100 × 70 / 200 = 35%
P2 = %C2H4 = 100 × C2H4 (g2) / T(g) = 100 × 110 / 200 = 55%
P3 = %C2H2 = 100 × C2H2 (g3) / T(g) = 100 × 20 / 200 = 10%
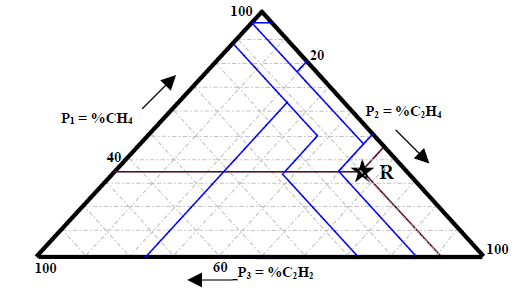
Plot a point on the triangle which is 35% of the way up the CH4 axis, 55% of the way down the C2H4 axis, and 10% of the way across the C2H2 axis. The arrows next to each side of the triangle show the direction of each axis which corresponds to only one point called R in the right side of the Triangle.
The point representing our gas data falls in the T3 fault zone, indicating a high-temperature thermal fault (T3), which is typically a “hot metal” fault.
CONCLUSION
In this article an implementation of Duval Triangle DGA diagnostic method was investigated. This method is widely in use for interpreting DGA data.
Share on Facebook